vnstat-web
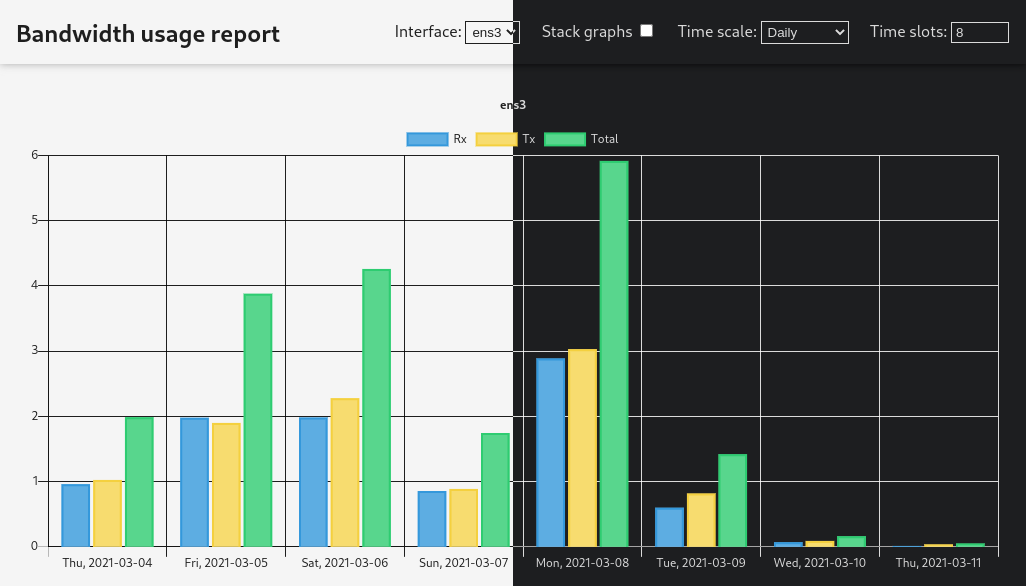
A web interface for vnstat using Chart.js for visuals.
Features
- Automatic light/dark theme
- Colorful graphs
- User-selectable time scales:
- hourly
- daily
- monthly
- yearly
- top days
- Supports any network interface monitored by vnstat
Important note
This is a very new project, and as such, there will probably be many breaking changes in the near future. Use the latest tag if you want to deploy this software.
Usage
vnstat version 2.x must be configured first. To set up the web interface, simply place the following files in a directory served by your HTTP server:
index.htmlstyle.cssmain.jsChart.min.jsdata.php
Note:
data.phpmust be run by a PHP interpreter. Simply serving the static content will not work.
The data.php script will automatically get data from vnstat’s JSON output.
Make sure the vnstat executable is in the PATH of the PHP interpreter. If
you installed vnstat using a package manager, this should be done
automatically.
Configuration & customization
Currently, no central configuration/customization location is provided. To
customize the page structure, edit the index.html and style.css files. To
customize the behavior of the graphs and data processing, edit the main.js
file, which includes comments to enhance readability.
There shouldn’t be much need to edit the data.php backend, but that’s where
the backend code is located if it needs to be changed.